Custom Policy
Upload analysis PDF
Recommended Scenarios
Interactive System: Click nodes to toggle sector activity
AI Policy Agent
System Awaiting Input
System activity and emissions propagate through connected sectors.
Emission Forecast (AI Prediction)
▼
AQI Trends & AI Forecast
Analysis based on historical sensor data + predictive AI modeling.
Loading Historic Data...
Historic Monthly Trends (2019-2025)
CO₂ Emissionskt
Air Quality Index (AQI)
Policy Impact Simulator
Select Policies to Simulate
Select one or more policies above to see their impact on 2026
Policies can be combined for cumulative effect
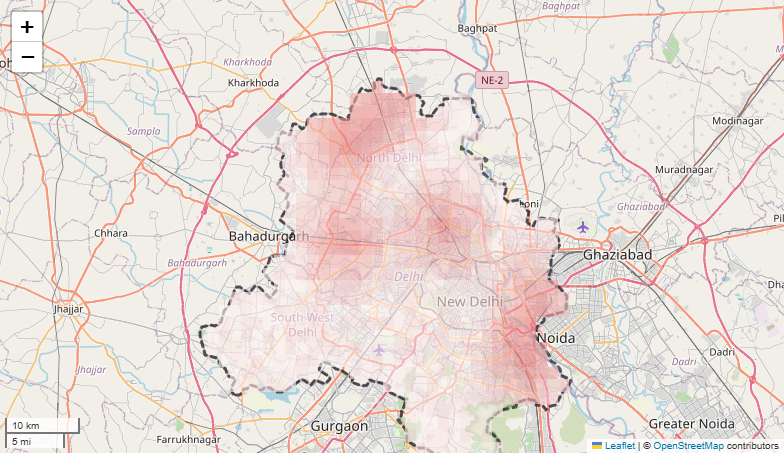
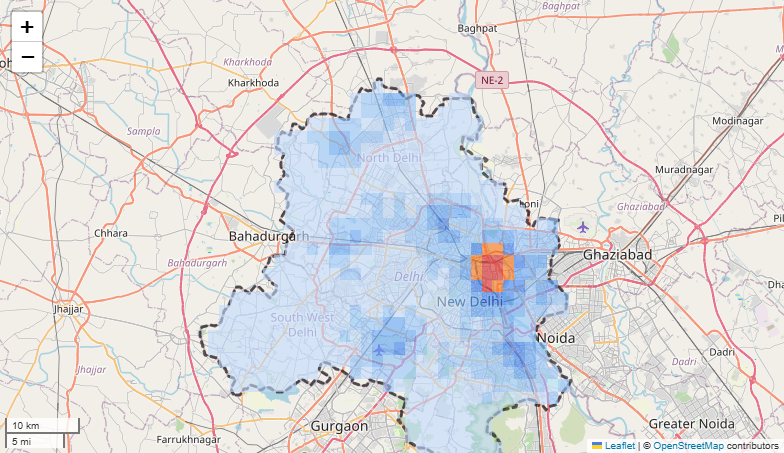
🗺️ Delhi AQI Heatmap
Loading Heatmap...
Clipped grid analysis via Folium & Geomapping.
Interactive View →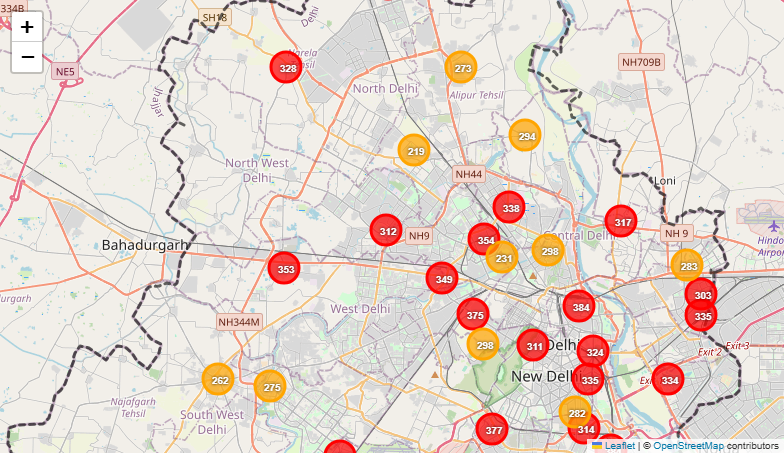
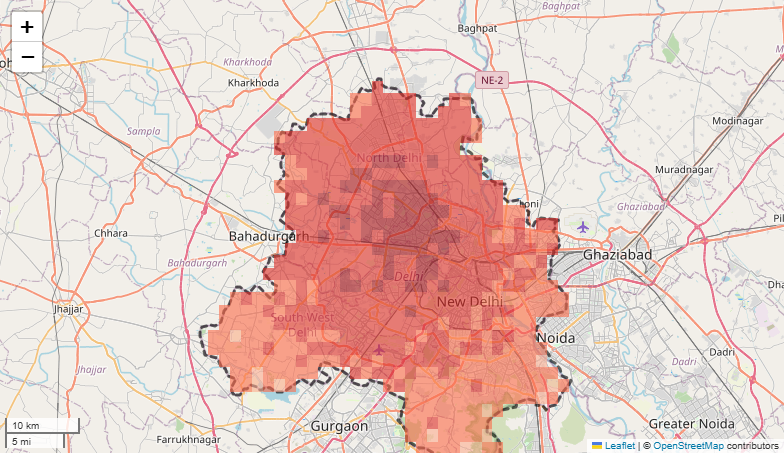
🌡️ CO₂ Emission Heatmap
Loading Heatmap...
Grid-based CO₂ concentration analysis across Delhi.
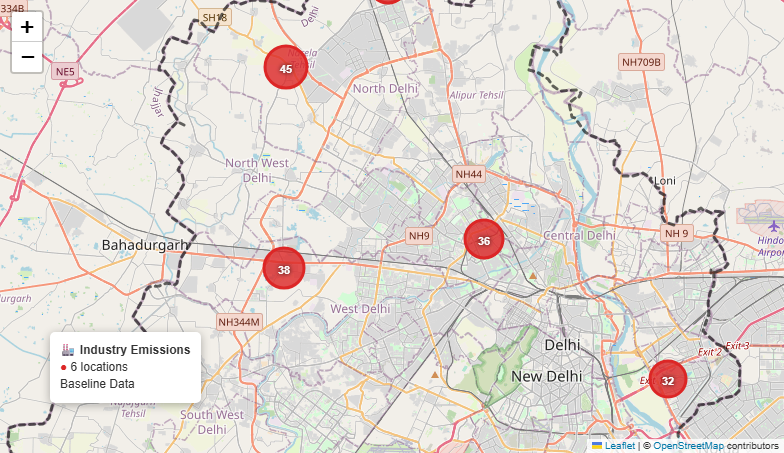
Interactive View →🏭 Emission Sources
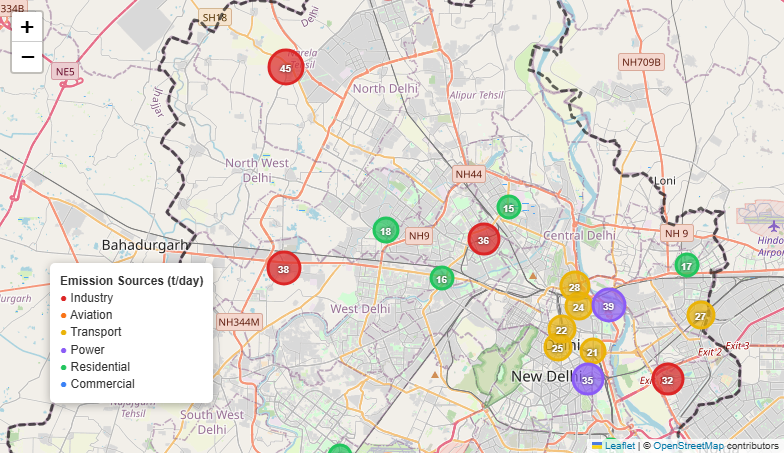
Loading Emission Sources...
Sector-wise emission sources: Industry, Transport, Power, Residential.
Interactive View →